tl;dr – Since 1945, once the S&P 500 has pulled back 13% like it reached yesterday, ~50% of the time the market bottom is within 5% and ~75% of the time the market bottom is within 10%, so I believe the time to buy is now. However, the >22% corrections have often occurred following strong prior two-year returns, high P/E multiples, and rising interest rates, all of which are present now, thus I believe stock selection is particularly important currently.
To start, I want to say that I am not a “macro” guy. I’m a stock picker and I consider my research my first line of defense. I have done very little trading in the last two weeks, though as I explain below, I think now is the time to think about repositioning. Having said that, markets go through pullbacks and corrections all the time, and it makes sense to have a mental framework on how to approach them when they do. In this framework, I have a general rule based on market history that, once a market is down around 15%, there’s no real purpose in worrying about a recession or further correction. While that doesn’t mean to just YOLO and buy whatever is down the most regardless of cash flow, liquidity, etc., historically there are very few market corrections of >22% and those that do almost always correspond with very large macro events and take years to play out. My best investment periods have almost always occurred after market drawdowns and the one in four chance that we might have an even better buying opportunity later should not deter me from making moves now.
Below I’ve listed some historical stats on S&P 500 corrections since 1945, including some details on certain large pullbacks. I also have a chartbook showing what they looked like with some further details.
Frankly, there are a lot of ~15% selloffs. They happen every two or three years, sometimes with a recession, sometimes without, but they generally aren’t big enough to care about beyond the immediate sense of displeasure. For instance, the market fell about 14% when the Korean War broke out, but look at the chart:
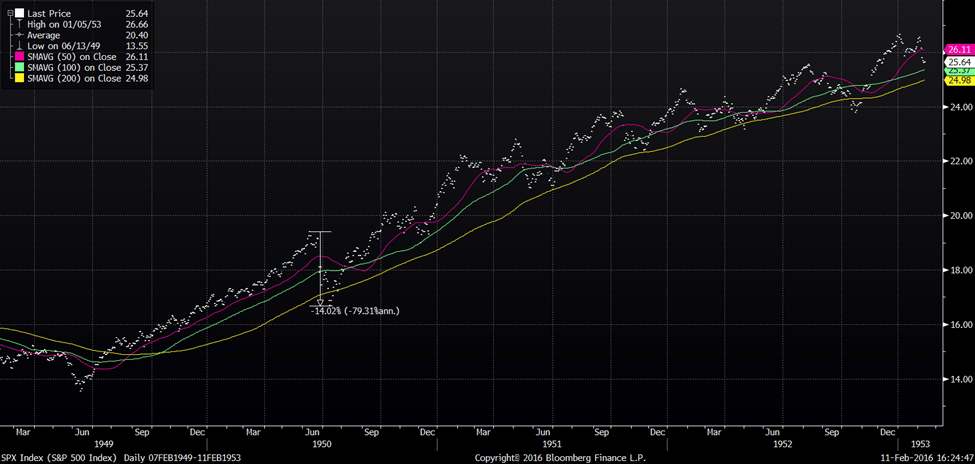
Down 13% was clearly not the time to sell…
While I’m painting a bull case here, I don’t mean to downplay the risk of a larger event and I think it’s wise to have some context about larger corrections. The nine >22% corrections since 1945 fall into two basic categories: 25-35% crashes that rebounded quickly and very major economic events, typically involving very large rate increases, that played out over a multiyear period. As for the panics, they are random but have followed very large upward S&P 500 rallies in the prior 18 months. Regarding the current market, it’s a fair point of caution that the S&P 500’s ~45% rally since Fall 2020 meets this criterion, while the Nasdaq and certain sectors like SaaS experienced even larger moves. However, I wouldn’t oversell this point as there are lots of examples of significant 18-month rallies that didn’t turn into larger corrections – see the chart of 1950 above. Further, even in those larger crashes, if you bought the market down 15%, you were roughly flat or above breakeven within 12 months anyways.
As for the large recession selloffs, three of them involved rate hikes of >500bps, logically resulting in an increasing equity premium and a decreasing P/E multiple. With the Fed entering a rate hike cycle while inflation explodes, this is my largest concern, but I don’t yet have a view that the Fed will be forced to move more significantly than anticipated. The other three have differing explanations: significant overvaluation in the Dot Com bubble, the massive 35% earnings contraction in the Great Recession, and a mixture of a crash and a record sharp economic contraction in 2020. In these cases, unique circumstances impacted sectors and stocks quite differently. At points, it mattered little what you owned, but after a few months, stock picking eventually won out. There was a huge difference in the 2000 Dot Com Crash whether you were long MSFT or JPM and yet again in the 2008 Financial Crisis. It’s the job of a stock picker to figure out which one to buy.
Circling back to my original point, there’s a lot of macroeconomic volatility today and the Russia-Ukraine war will have profound impacts on certain industries. I need to be honest with myself about what risks I am taking. It may be wise to buy TiO2 producers or short oil futures, but those decisions need to be backed up with research and not thrown on in a childishly contrarian manner. The point of my historical analysis, though, is that whatever real macro events are to follow, most of the time, down 15% was good enough to accommodate the market risk running through your portfolio. Once it has corrected that much, I think it’s time to stop worrying about whether the market is going to move up or down 200bps tomorrow and to start focusing on what securities are down the most and shouldn’t be.
Happy hunting.
Note: A thanks to Yardeni Research for some of the data used in this analysis.

[…] recomendar una lectura muy interesante del blog de Chris McIntyre, CIO de McIntyre Partnerships: Historical Corrections: Down 15% Is Close Enough. A continuación dejamos un pequeño extracto, traducido del […]
LikeLike