Hello. I recently went on the Yet Another Value Podcast to present our thesis in Sotera Health Company (SHC), the fund’s largest investment. You can find the transcript along with links to the podcast here.
Thanks as always. Hope you are having a nice week.
Author: Chris McIntyre
NFLX Quick Thoughts
Disclaimer: I and my funds own common shares in NFLX. Do your own work.
Before we get to the stock, let’s briefly talk about NFLX’s business model. Reed founded NFLX as a distribution company, hired a bunch of Silicon Valley engineers, and optimized the hell out of video distribution – first DVDs by mail, then streaming. Knowing that NFLX’s business was just distribution and his suppliers, the TV and film studios, would eventually figure out streaming and cut him out, he had to backwards integrate and become a studio. However, he and the engineers had no idea how to make content, so they did what Silicon Valley does best and threw massive dollars at the problem.
So where does that leave us now? NFLX is now a slowing growth company – in my opinion, revenue growth is not over, but NFLX is certainly not a >30% grower – with a clearly bloated cost structure. Hollywood openly mocks them for how aggressive they are with content purchases:
South Park – How Netflix Answers Calls
From a studio executive friend:
“TV as a business and creatively works better when you have financial constraints, in my opinion. There’s a sweet spot between giving a production what it needs to secure the best talent and look great, and not just bloat a budget. Some great creative moments come out of producers having to work within budgetary constraints, which can force smarter storytelling choices rather than easier, more expensive ones. So as a consumer you could actually end up getting more, better produced content overall if you have more producers and studios operating responsibly… But not everyone is able to pull that type of management off consistently.”
For now, as I doubt Reed fully thinks growth is over and there’s obvious “platform” potential for NFLX, I wouldn’t expect a complete retrenchment, but over time I am sure NFLX will use their content budget more judiciously.
So where does that leave us? NFLX has roughly 125MM subs in developed markets paying $15/mo. and 100MM subs in emerging markets paying $8/mo. Rounded up that’s about $35B in revenues. At a 20% margin, that’s $12 in EPS, in line with Street for 2023. Legacy cable networks with scale consistently managed >30% operating margins, with most >40%. There’s puts and takes – wholesale/retail, international, ad supported, churn, etc. – but at its core, NFLX is not a wildly different business model. There’s definitely a lot of competition, so Netflix can’t just kick back and chill (#netflixandchilljoke), but at steady state, in my opinion, this is the largest subscription revenue business in history with medium-to-high pricing power and modest cyclicality – aka a pretty good business. 5-10% revenue growth plus a move towards 30% margins puts you at ~$25 in EPS in five years.
At $220, we are paying 18x current and 9x five-year out earnings. I think that’s a decent investment compared to the S&P 500, which is 18x 2023 and 14x five-year out EPS, particularly if you need to buy large caps. I also think you’re getting good upside skew here. There are a lot of ways numbers come in better than 5-10% revenue growth with 30% margins and this was 50x EPS six months ago, and, given the margin opportunity, I think it is hard to see earnings not growing over a few years. I’d also add that given the dominant position they have with a sticky, recurring revenue model, without a major change, it’s the type of thing I’d probably feel comfortable adding to if it went against me.
In my view, that makes NFLX a decent but not incredible idea. There’s no real term catalyst and I have no idea when and where this might bottom, but I’m cautiously interested and could see this as a bigger position at some point.
Historical Corrections: Down 15% Is Close Enough
tl;dr – Since 1945, once the S&P 500 has pulled back 13% like it reached yesterday, ~50% of the time the market bottom is within 5% and ~75% of the time the market bottom is within 10%, so I believe the time to buy is now. However, the >22% corrections have often occurred following strong prior two-year returns, high P/E multiples, and rising interest rates, all of which are present now, thus I believe stock selection is particularly important currently.
To start, I want to say that I am not a “macro” guy. I’m a stock picker and I consider my research my first line of defense. I have done very little trading in the last two weeks, though as I explain below, I think now is the time to think about repositioning. Having said that, markets go through pullbacks and corrections all the time, and it makes sense to have a mental framework on how to approach them when they do. In this framework, I have a general rule based on market history that, once a market is down around 15%, there’s no real purpose in worrying about a recession or further correction. While that doesn’t mean to just YOLO and buy whatever is down the most regardless of cash flow, liquidity, etc., historically there are very few market corrections of >22% and those that do almost always correspond with very large macro events and take years to play out. My best investment periods have almost always occurred after market drawdowns and the one in four chance that we might have an even better buying opportunity later should not deter me from making moves now.
Below I’ve listed some historical stats on S&P 500 corrections since 1945, including some details on certain large pullbacks. I also have a chartbook showing what they looked like with some further details.
Frankly, there are a lot of ~15% selloffs. They happen every two or three years, sometimes with a recession, sometimes without, but they generally aren’t big enough to care about beyond the immediate sense of displeasure. For instance, the market fell about 14% when the Korean War broke out, but look at the chart:
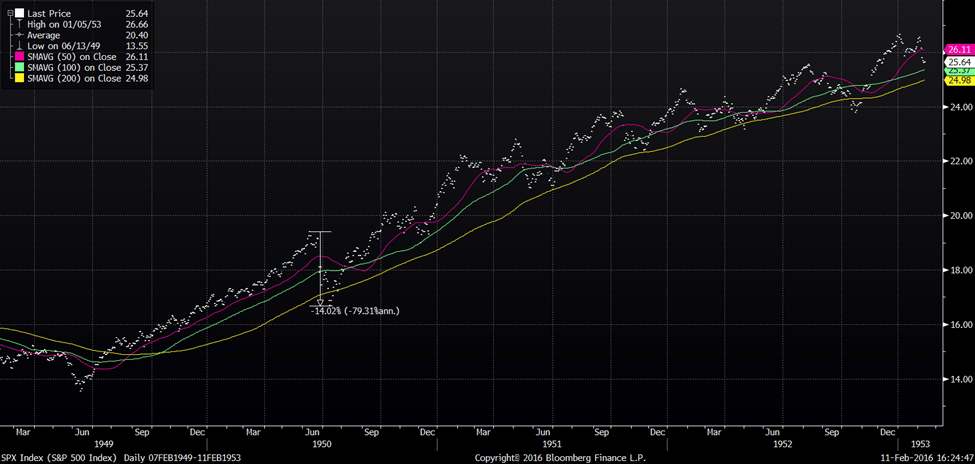
Down 13% was clearly not the time to sell…
While I’m painting a bull case here, I don’t mean to downplay the risk of a larger event and I think it’s wise to have some context about larger corrections. The nine >22% corrections since 1945 fall into two basic categories: 25-35% crashes that rebounded quickly and very major economic events, typically involving very large rate increases, that played out over a multiyear period. As for the panics, they are random but have followed very large upward S&P 500 rallies in the prior 18 months. Regarding the current market, it’s a fair point of caution that the S&P 500’s ~45% rally since Fall 2020 meets this criterion, while the Nasdaq and certain sectors like SaaS experienced even larger moves. However, I wouldn’t oversell this point as there are lots of examples of significant 18-month rallies that didn’t turn into larger corrections – see the chart of 1950 above. Further, even in those larger crashes, if you bought the market down 15%, you were roughly flat or above breakeven within 12 months anyways.
As for the large recession selloffs, three of them involved rate hikes of >500bps, logically resulting in an increasing equity premium and a decreasing P/E multiple. With the Fed entering a rate hike cycle while inflation explodes, this is my largest concern, but I don’t yet have a view that the Fed will be forced to move more significantly than anticipated. The other three have differing explanations: significant overvaluation in the Dot Com bubble, the massive 35% earnings contraction in the Great Recession, and a mixture of a crash and a record sharp economic contraction in 2020. In these cases, unique circumstances impacted sectors and stocks quite differently. At points, it mattered little what you owned, but after a few months, stock picking eventually won out. There was a huge difference in the 2000 Dot Com Crash whether you were long MSFT or JPM and yet again in the 2008 Financial Crisis. It’s the job of a stock picker to figure out which one to buy.
Circling back to my original point, there’s a lot of macroeconomic volatility today and the Russia-Ukraine war will have profound impacts on certain industries. I need to be honest with myself about what risks I am taking. It may be wise to buy TiO2 producers or short oil futures, but those decisions need to be backed up with research and not thrown on in a childishly contrarian manner. The point of my historical analysis, though, is that whatever real macro events are to follow, most of the time, down 15% was good enough to accommodate the market risk running through your portfolio. Once it has corrected that much, I think it’s time to stop worrying about whether the market is going to move up or down 200bps tomorrow and to start focusing on what securities are down the most and shouldn’t be.
Happy hunting.
Note: A thanks to Yardeni Research for some of the data used in this analysis.
The Bird in Hand: NFLX, HLMN, and Current Free Cash Flow
Disclaimer: I and my funds own common shares in NFLX and HLMN.
TL;DR – Stocks with high current FCF yields benefit from price declines in a way which can materially impact IRRs that is not present for high-growth , no-FCF stocks with similar IRR potential. I consider the current FCF of investments a “bird in hard” versus more speculative longer-dated cash flows, and that’s why I strongly prefer high FCF investments.
To explore this, I want to compare two stocks I think are “B+” type ideas with similar IRRs at present: NFLX and HLMN. Full disclosure, the fund made small long investments in each last week, and I know a great deal more about NFLX than HLMN as I have followed NFLX for over a decade and HLMN only recently came public. I chose HLMN as an example of a high current FCF stock, rather than some of the fund’s larger holdings, to avoid turning this into a stock pitch. I want to talk about the strategy of why I think HLMN is an easier stock to own, rather than a detailed analysis of each business.
Before we begin, I want to talk about how I approach valuing a high-growth, no-FCF investment like NFLX. In my opinion, it is perfectly logical to assume certain growth companies could, either presently or in a reasonable time frame, generate significantly higher operating margins and FCF than their current results if it were not for growth investments. To compare to these stocks to those with more normal operations, I prefer to estimate a reasonable long-term margin and calculate run-rate EPS/FCF. As I am speaking theoretically, I will use EPS and FCF interchangeably. However, the key detail here is that unless the current P/E multiple is so cheap that multiple expansion is probable, the no-FCF stock’s sales growth will roughly equal its IRR potential. I’m assuming a simple model with no financial leverage or share count change. The point I’m trying to show is that for other than truly exceptional high growth companies – say greater than 25% sales growth – the IRR is not materially different than buying stocks that are cheap on current FCF with modestly above GDP sales growth. Further, I’m going to argue that as a significant part of the IRR is driven by a return of capital despite a less competitive, more mature businesses, I believe high current FCF yield stocks are better risk/reward adjusted investments.
So let’s talk NFLX, a popular example of a high-growth, no-FCF stock. To run my theoretical model, I am going to assume NFLX can reach a 35% operating margin. Legacy cable networks, HBO, Starz, etc. typically had 30-40% operating margins with similar business models. There are reasons it could ultimately be higher, such as the ability to lever content costs across more users, as well as reasons it could be lower, such as material EM exposure at lower ARPUs and the lack of advertising revenue, but I think 35% is a fine estimate and it’s not too far from what the Street models NFLX achieving in a few years. This assumption yields roughly $20 in 2022 EPS assuming a 25% tax rate. After a recent 50% drop, NFLX is trading 18-20x earnings, which is roughly in-line with the S&P 500 and a heck of a lot cheaper than the 35x it was trading a few months ago. While NFLX is hitting some growth hiccups, not shocking given the 2020 COVID surge and the sheer size NFLX has already reached – 220MM at quarter end versus 600-800MM people in the world who make over $20k/year, I do not believe its business is in any real trouble and I think it will continue to grow over the next few years. I estimate NFLX will see topline growth of ~15% in the next few years – maybe a bit more, maybe a bit less. However, NFLX has no real near-term FCF, so the rapid decline has no benefit to long-term shareholders and may in fact dilute long-term returns given significant employee stock compensation. Despite the painful decline, NFLX’s revenue growth rate will equal its IRR unless NFLX’s multiple expands, something I am loathe to assume for a stock at market multiples without a clear catalyst. Bulls might argue 20x is too low for a business “this good,” but it’s only in a few recent years that >30x multiples have become acceptable. A 15% IRR is above the Street’s 2022 and 2023 S&P 500 EPS growth rate of ~9%, but we are giving NFLX some credit for things it has not yet achieved and the name has been exceptionally volatile at points, both of which warrant caution. Still, I consider a 15% IRR a pretty good yet not amazing result, hence my feeling that it’s a “B+” type idea.
Now let’s look at HLMN, a stock I picked because I think it’s a solid example of a typical “value stock”: good but not explosive growth, historical stability, and cheap to the market on near-term EPS and FCF with capital return plans. HLMN was written up on VIC in August 2021, and the post does a good job summarizing the story. The company has grown sales at a 6% CAGR over the last twenty years, 10% including M&A, and is currently trading at ~7.5% FCF yield on 2022 numbers. Assuming the organic growth continues and HLMN returns its cash to shareholders, I calculate a 13.5% IRR, a tad below our NFLX IRR. However, let’s explore two different thoughts: what happens if HLMN experiences a 50% drop as NFLX just did and the risk benefit of capital returns.
If HLMN drops 50%, all else equal, our IRR potential jumps to 21%, with 75% of our IRR generated from capital returns. This significant change in IRR is a big reason I favor stocks with significant near-term FCF. On any given day, stock prices can do whatever they want, and sometimes they fall from the sky. All FAANG stocks have experienced a 50% decline since 2010. At least with high FCF stocks I can benefit from that volatility at the investment level via buybacks. Of course, I can benefit from that volatility from purchasing additional shares as well. For NFLX to reach a 21% IRR, we need to assume a multiple expansion to say 26x over five years, which is not wild assumption but not a shoo-in either. But what if we were to assume HLMN could see multiple expansion as well? A 15% FCF yield is a 65% discount to the S&P 500, and we are modeling HLMN to retire or dividend 75% of its market cap in five years. Assuming we reweight backward towards 13.5x at the end of five years, our IRR becomes 39%. For NFLX to match that IRR, we need to assume a 52x exit multiple.
Personally, I have a lot easier time underwriting multiple expansion on a stock where capital returns are front-end weighted than one with years of assumptions in front of it, which is my point about the risk benefit assessment I make to favor high current FCF stocks over high-growth, no-FCF stocks with similar IRR potential. In both cases, we still need to be right about our assumptions. If some competitive threat comes along in year three and blows the business’s fundamentals up, we are going to lose money. However, in the HLMN example, assuming the company does the lowest risk thing and dividends cash, we would have lowered our risk by 15-30% by then. Further, it’s unlikely that a competitive threat would drop FCF to zero overnight, and we could still benefit from capital returns and/or a better exit multiple when we decide to throw in the towel. When the market senses a high-growth, no-FCF stock might never make a profit or is heading for a liquidity issue, the bottom is often down significantly given the elevated multiples these names trade. Finally, I’d add that I think estimating threats a few years out is inherently more challenging in an end market growing 30% or better, such as cloud, than in one growing at closer to GDP rates. The allure of that rapid growth and the potential for massive winners simply attracts far more competition than one finds in the more mature industries.
Putting it all together, I just think it’s an easier risk-adjusted investment strategy to largely limit my ideas to those currently generating significant FCF. Maybe the market will go back to favoring the high-growth, no-FCF stocks – I have no idea and the current selloff could just be a pause in an ever-increasing growth multiple world – but I am still going to keep my investment focus on cash flow. Time will tell.
Growth vs. Value vs. Logic
What happened if you paid 20x sales for MSFT at IPO? What happened if you assumed AMZN could hit WMT’s margins?
Before I begin, I have a confession to make. Despite running a “value” fund, I am actually an AMZN shareholder. Since 2013, I have owned exactly one share. The purchase served several purposes – for instance, a reminder never to short it – but I primarily bought because I saw the competitive advantages and growth opportunities. At the time, I was a consumer analyst at a hedge fund and saw the shift to e-commerce and the challenges brick-and-mortar retailers faced to adapt. AMZN was clearly winning, and the gap was only growing harder to bridge. In my mind, the question was not whether AMZN was the type of investment I wanted to make but at what price. The same can be said for MSFT, the other subject of this post. While MSFT might have been a bit further in its growth curve, it doesn’t take a genius to realize a 40-year monopoly on PC operating systems and a ubiquitous suite of office work staples make good barriers to entry. Sadly, I never owned either in size and since my AMZN purchase in Fall 2013, AMZN and MSFT revenues have grown 526% and 126%, respectively, which compares to the S&P 500 at 40% – software is indeed eating the world. However, there is a small catch: despite AMZN considerable outgrowth, MSFT shares are the slight outperformer, rallying 958% vs. AMZN’s 933% and the S&P 500’s 176% return. The explanation is that MSFT has experienced significant multiple expansion. In the early 2010s, as current tech bulls may forget, MSFT and many other tech companies traded at below market multiples due to fears surrounding the impact of cloud computing and the shift from desktop to mobile. As MSFT executed and emerged as a leader in cloud computing, its multiple expanded significantly from 10-13x EPS in 2013 to 30-40x today. Which brings me to the point of this post – entry price matters.
In the current tech bull market, there’s a popular belief that growth trumps all and entry price is for “old timers.” There are now dozens of companies trading 20x EV/Sales or more, a level that would have been considered “ridiculous” only a few years ago. Like any popularly held belief, there is some logic and support behind it. The general idea is that if there is enough growth, the long-term compounding of said growth, along with the subtle if unstated belief that superior margins are inevitable, will dwarf any difference in entry price. (This recent, well-written piece is geared towards early-stage investments but lays out the thesis.) Bulls can point to numerous recent success stories of the wisdom of paying up, from Andreessen Horowitz famously breaking the post-Dot Com Silicon Valley paradigm to hedge funds riding a wave of SaaS to market beating returns. While the “old timers” might point to numerous previous periods of tech exuberance ending in crashes, bulls can simply retort, “I’m just going to hold – just look at MSFT and AMZN!”
So, let’s put this strategy to the test. What if instead of looking at recent success, we went back to MSFT’s IPO and applied a 20x sales framework? Surely if bulls are comfortable paying 20x EV/Sales for numerous names currently, they’d be comfortable buying the ultimate winner – the world’s largest company with 42% margins – at IPO. Further, let’s ask if we actually had to pay up to get these amazing returns seen lately. I’ve already established that we could have purchased MSFT at a reasonable price a decade ago, but what about AMZN? Jeff Bezos aggressively reinvested and ran his company at negligible profits for years in pursuit of the dominant position it reached today, but could we have made reasonable margin assumptions and valued it versus peers? Let’s dig in.
MSFT IPOed on March 13, 1986, at a price of $21 per share with roughly 24.7MM shares outstanding, yielding a market cap of $519MM. In MSFT’s fiscal year ending June 1987, the company had revenues of $346MM. Using a 20x multiple, that implies a market cap of $6.9B, 13x its actual IPO price. Compared to MSFT’s current cap of roughly $2.5T, that yields an IRR of 18.0%. Not too shabby. (Yes, I realize MSFT has had a dividend in recent years, but it’s small, difficult to adjust into IRR, and wouldn’t move this math much.) However, let’s put some context around that. During this time, the S&P 500 annualized return was 11.2%. MSFT stock is still a solid outperformer, but humbler than I think most would expect for buying the tech GOAT at IPO. MSFT also experienced a not-so-subtle 16-year “pullback” where one had to maintain their firm belief in MSFT’s inevitable re-emergence as a leader. One would have had to maintain this belief as MSFT repeatedly missed virtually every major tech trend for two decades: the initial growth of the internet, e-commerce, search, consumer electronics, social media, mobile, streaming video, etc. Any weak-handed trading in that stretch could easily have cost a few hundred bps off our IRR.
Now let’s approach this from a portfolio perspective. So far, we are only looking at MSFT, an unquestionable tech winner, but very few investors are proposing to buy exactly one stock. What could our long-term tech portfolio have looked like? The second and third hottest IPOs of 1986 were ORCL and Sun Microsystems. How have they done? ORCL has achieved a 20.1% CAGR since then, but it falls to 13% if you paid 20x sales. Sun Microsystems was eventually acquired by ORCL for a 9.4% CAGR since IPO, but at a sub-1x sales exit multiple and for $5.6B ex-cash. The fourth hottest 1986 IPO? Teknowledge, the era’s leading player in artificial intelligence. It eventually got absorbed into a Pittsburgh industrial. IBM’s CAGR is sub 5%, and it traded nowhere near 20x. This pattern would also hold for tech companies in a later era. If you paid 20x EV/Sales for GOOGL’s IPO, your return would be 20.7%. But you better not have bought Yahoo, Lycos, AOL, Cognos…
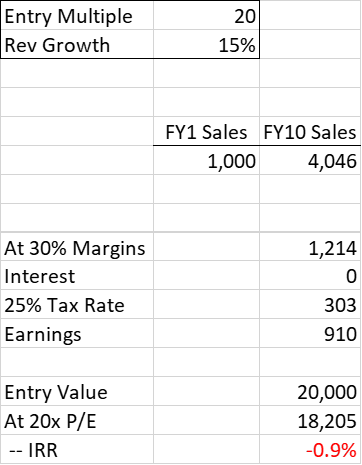
Historically, it’s been exceedingly difficult to pay 20x sales for a portfolio of companies and end up beating the market in the long run. A simple model shows why – you must grow at an outstanding rate for 10+ years and you cannot exit anywhere near a market multiple. Take, for example, a company that grows sales at 30% for 10 years and achieves a 40% operating margin. If we exit at a 30x P/E multiple, or a PEG of 1.0 assuming margins are stable, we achieve a 20.0% IRR:

That’s actually very close to MSFT’s return in the 1990s. MSFT’s revenues went from $1.84B in 1991 to $25.3B in 2001, a 29.9% CAGR, and traded ~25-35x EPS in the early 2000s. By buying at 20x EV/Sales, bulls are basically saying, “I am long MSFT-type companies, and only MSFT-type companies, to achieve a 20% IRR.” If a company instead “only” achieves a 15% revenue growth rate, 30% margin, and a 20x P/E at exit, we lose money:
For reference, that’s basically ADBE in the 1990s. Sales grew at roughly an 18% CAGR, achieved 28-33% operating margins, and the stock traded 20-25x in the early 2000s. In my opinion, a strategy where we make 20% IRRs if we only pick MSFT and we lose money if we pick ADBE, in its own right an excellent business, is not a particularly good risk/reward investment framework.
Which brings me back to my central point: entry price matters. If we are going to pick a long-term winning strategy, completely ignoring entry price is unlikely to be a wise decision for anything beyond small, early-stage businesses. So, let’s take AMZN. For years, “value investors” derided AMZN as a nice company that did not make any money. In fairness, AMZN’s lack of GAAP profits or FCF made it difficult to analyze, but could we have used reasonable assumptions and found an entry at reasonable prices?
Back when I bought my (massively sized) AMZN investment, I created a general framework to assign AMZN a P/E multiple. At the time, given AMZN’s “everything store” approach, I thought of AMZN as WMT without the stores. I guessed that if it weren’t for all its growth investments, AMZN could at least achieve WMT’s margins plus 200bps. I then backed out taxes for a guess owners’ earnings. My reasoning was simple. Rent is typically 5-15% of sales for a retailer, plus AMZN had significant 3P revenues (EBAY at ~20% margins) and Prime subscriptions which I felt made my assumptions conservative. AWS was relatively small at the time, but I saw the opportunity and figured a business with significant software components could at least achieve WMT’s margins. However, given my concerns on eventual margins – at the time, renting a server seemed pretty commodity to me – I was humorously only willing to buy AWS “for free.” Applied retroactively, here’s the general look of my work:
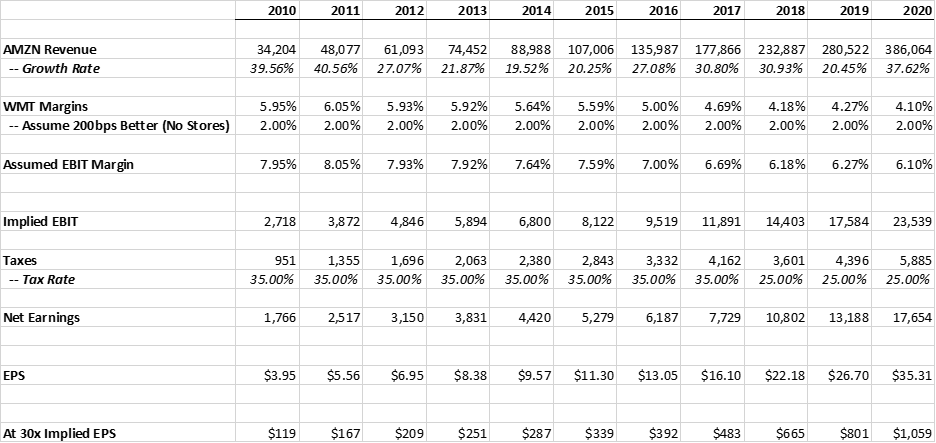
At the time, growthy retailers typically traded 30x or more EPS (ULTA, WFM, COST) while mature retailers traded closer to 15x (WMT, TGT), so anything sub 30x was a starting place to enter AMZN. So how often did AMZN trade at a “reasonable” multiple using my framework?
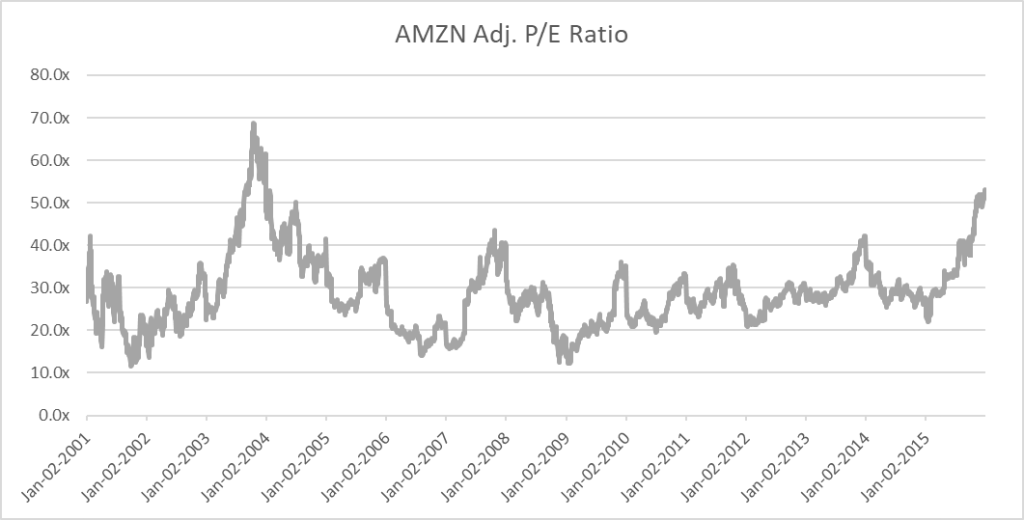
If you assumed AMZN could earn at least slightly superior margins to WMT, you could have bought AMZN at 20-30x EPS almost every year from 2001 to 2015. From 2016 onward, the growth of AWS, my previous “freebie,” began to achieve 30% margins and fundamentally reshape the thesis. AMZN might not have been as clear an earnings story as MSFT, but with simple assumptions, AMZN was not some pie-in-the-sky, YOLO revenue story but a modestly expensive yet rapidly growing business.
Conclusion
Stepping back, my general point is that investors are ignoring entry prices at their own peril. 20x Sales at a 30-40% margin and a 25% tax rate is 65-90x earnings, and compression toward even an above market 20-30x multiple leaves you 50-75% in the hole, which is awfully hard to overcome. Further, until recently, most technology stocks traded at reasonable multiples. It’s only in recent memory that multiples have skyrocketed. You still had to pick the correct stocks – IBM and Teknowledge wouldn’t cut it – but you did not have to cross your fingers and hope you exit nowhere near a market multiple.
Finally, in no particular order, some closing thoughts:
- This does not really apply to very early-stage investments. If a company can 1,000x revenues in a decade, multiple is less important, but that is incredibly unlikely with >$1B revenue investments.
- To achieve better than 20% IRRs, you really need to be rotating ideas in addition to and/or instead of picking long-term winners. If MSFT and GOOG at IPO prices reach only mid-20s IRRs, it is incredibly unlikely a portfolio of 20 or 30 stocks held for 10+ year will reach that. Personally, I am still a fundamental investor but prefer to follow the long-term winners and buy them at attractive entry points – earnings misses, macro crises, etc., but I cannot deny that some investors successfully deploy short-term trading strategies that ignore fundamentals.
- For simplicity, I am ignoring taxes but they would have an impact. However, I would argue the largest impact is short-term vs. long-term capital gains, rather than the pre-tax compounding on assets after long-term status is reached. I might elaborate on that later.
- Entry strategy is important, but exit strategy is even bigger. This post only addressed scenarios where we bought companies that emerged as winners, but every investment strategy will encounter losing investments and growth strategies have historically encountered many long-term misses. How that is managed is ultimately a bigger deal than entry price.
Garrett Motion (GTX)
Disclaimer: I and my funds own common and preferred shares in GTX.
To launch the blog, I’d like to introduce you all to my current top idea – Garrett Motion (GTX), a global auto supplier. Along with the blog, I have launched a website – GTXisacheapstock.com – with a slide presentation to help walk you through why I think the opportunity is so interesting. For simplicity, the blog post is geared towards a “stock pitch” while the website digs a bit more into the fundamentals. I want this blog to be an informal space for ideas, so while I have strong and favorable views on GTX’s long-term business fundamentals and earnings, the tone of this blog post is much closer to a pitch at a dinner with friends rather than a formal presentation.
The basic pitch is that GTX is a high-quality, growing business that went through a non-fundamental bankruptcy to restructure a contingent liability, which has created an opportunity to purchase shares at a 5x 2021 FCF/sh., compared to primary competitor BWA at 13x, into rising earnings and strong technical catalysts, such as GTX’s preferred share listing and brokerage firms reinitiating coverage.
GTX is an excellent business that handled the 2020 recession admirably, with sufficient liquidity and positive EBITDA throughout the downturn. However, GTX had lingering lawsuits with its former parent, Honeywell (HON), related to pre-1985 asbestos liabilities that have nothing to do with GTX’s current business. These lawsuits and liabilities significantly limited GTX’s strategic flexibility and made the stock difficult for investors to understand. To resolve these disputes, GTX filed for bankruptcy in late September, effectively forcing HON to settle. After a long, hard-fought bankruptcy process, GTX and HON have fully resolved their dispute, GTX has completed an equity recapitalization to “cash out” HON, and GTX recently emerged as a cleaner, simplified story. However, due to technical selling pressure from the equity issuance and a lack of analyst coverage, the broader market has yet to realize both how much GTX has transformed and how cheap shares are at present. When GTX filed, it was a highly levered equity with a hard-to-understand liability in the midst of a worrying auto recession. It is emerging as reasonably levered equity into a V-shaped auto recovery in which GTX operations have already fully recovered, with GTX positing record Q1 sales and profits. Despite this marked improvement, I believe GTX is trading at 5x 2021 and 4x 2022 FCF/sh., which compares to its primary competitor BWA which trades 13x and 11x 2021 and 2022 EPS with similar leverage and a slower recovery. As GTX relists, updates numbers, and investors rediscover the story, I believe GTX can reweight towards auto peers, driving >100% upside by YE2021.
Before I dig into numbers, I want to talk about GTX’s business, which I believe is one of the most predictable, deep-moat businesses I have ever analyzed. GTX makes turbochargers (TBs), which are a high-tech, mission-critical component of a car’s engine. The TB market is a duopoly between BWA and GTX. While there are also smaller Asian competitors, GTX and BWA enjoy significant engineering and R&D advantages over peers that create a moat and allow GTX to earn among the highest margins and lowest annual price downs of any publicly traded auto supplier. TBs are basically mini-jet engines that take the exhaust fumes and push that air back into the engine, increasing both power and fuel efficiency. TBs are extremely sophisticated devices – the TB’s turbine spins at up to 150,000 RPMs yet the distance between the spinning turbine and the wall of the TB can be as small as a seventh the width of a human hair. GTX’s years of R&D in the space allow them to deliver products that competitors just cannot match. As a testament to this, Bosch and Mahle, two of the largest auto suppliers in the world, launched a TB joint-venture in the late 2000s with the explicit blessing and support of GTX’s customers, the auto OEMs. A scaled competitor teaming up with your customers to break your duopoly is a business nightmare, yet after a decade, Bosch-Mahle gave up and exited the space. They simply could not match GTX’s products. The duopoly market and barriers to entry give GTX clear visibility into their market share and margins. Further, the TB is a critical component of an engine, which is the critical component of a car. Engines are designed years in advance and, once a product is designed into an engine, it is virtually impossible to design out. Once Volkswagen designs a Garrett TB into a Jetta engine, GTX has an almost guaranteed 100% renewal product with a multi-year life cycle. GTX’s backlog is exceptionally sticky and 90% booked 3+ years out, thus GTX has years of visibility. Further, GTX has broad share of the TB market with no significant geographic, customer, or model concentration. With no significant competitive threats, minimal risk of contract cancellation, and a broad customer mix, the only key variable with any difficulty to model years in advance is global auto production, which I’ll handle in next paragraph. Beyond global auto sales, GTX is one of the most predictable businesses I have ever studied.
Given GTX’s predictability, the key variable in GTX’s earnings are global auto sales. In general, I believe the auto market is cyclical, but not wildly so, with roughly GDP or ~2% type growth at trend. In developed markets, auto is basically a replacement market, whereas emerging markets have lower levels of cars per capita and are in growth mode. In 2018, the global auto market entered a recession due to the tariff wars and the slowdown in China, and in 2020, the covid shutdowns significantly accelerated this. From 2017 to 2020, global autos fell over 20%, the largest peak to trough recession of the post-WWII era. We are now bouncing off this and, if GDP continues to rebound, I believe global autos are entering a multi-year upcycle. IHS estimates low teens growth in 2021 which slows to mid-single digits in 2022. They currently anticipate it will take until after 2025 to reach the previous peak. Personally, I think these estimates are likely to prove conservative – IHS has consistently underestimated the rebound since reaching a trough in 2020 – but I consider a faster than expected auto recovery “icing on the cake” rather than core to the GTX thesis.
One final note on TB’s before delving into numbers. TB penetration of internal combustion engines (ICE) has been increasing over the last few years and there is high visibility into further growth. Globally, rising CO2 standards are forcing auto OEMs to improve efficiency. While battery electric vehicles (BEV) are the most talked about solution, the largest beneficiary in the next few years will be hybrid vehicles, of which TBs are a critical component. Historically, people associate TBs with speed – more Fast and Furious than Captain Planet. However, TBs add power to an engine, which can also be harnessed to decrease engine size and increase gas mileage. As carbon emission standards increase, TBs logically have been gaining share. IHS expects TB penetration of total cars produced to increase from approximately 47% in 2017 to approximately 53% by 2023. GTX estimates this shift will provide at least a 400-600bps per year boost to GTX’s sales growth and GTX has been outperforming their guidance. Ultimately, I believe BEVs will grow to one day overtake ICE and dominate the auto market. However, as I address below, I believe TB’s secular decline is a post-2030 event.
Regarding GTX numbers, the company’s current forecast implies $520MM and $267MM in 2021 EBITDA and FCF, which increases to $596MM and $310MM in 2022. However, the company has been substantially outperforming this, with Q1 EBITDA reaching $176MM vs. guidance of $129MM and sales growth ~1500bps over global auto sales. I believe GTX can earn closer to $658MM and $774MM in 2021 and 2022 EBITDA. The company has ~$110MM in annual capex needs, PF $48MM in interest, and a ~24% tax rate, yielding FCF of $383MM and $461MM, respectively. Assuming 313MM shares outstanding, I believe GTX can earn $1.22 in 2021 FCF/sh. and $1.47 next.
Regarding sharecount, it is a little tricky but not overly so. While I have earlier referred to GTX’s equity raise to repay HON, technically the raise is in the form of convertible Preferred A shares struck at $5.25 per share, and HON has a remaining Preferred B share with a present value of $584MM. While this may seem complicated, it is actually a fairly simple structure. GTX issued $1.3B of the Preferred A shares, which will convert into 248MM shares, and GTX has 65MM current shares outstanding. The structure is designed to collapse when GTX reaches $600MM in EBITDA, with HON fully repaid and 313MM shares outstanding. Originally this was forecast for 2023. However, GTX is already at a greater than $600MM EBITDA run rate and GTX exited bankruptcy with significantly more cash than originally envisioned. I believe HON will be repaid by YE2021. The Pref A will likely continue to trade until 2023, and it should be listed on major exchanges by the end of July. Investors are free to choose between an investment in common or the preferreds, but I believe it makes most sense to think of GTX on an as converted, fully diluted basis with 313MM shares outstanding. GTX management seems to agree and their recent Q1 earning presentation provides similar commentary and math: https://s2.q4cdn.com/726657224/files/doc_financials/2021/04-29-21-Q1-2021-Presentation-Final-1122.pdf
Regarding risks beyond global auto sales, where I strongly believe the 2020 recession marked a bottom and we are entering a multiyear recovery, the key risk for GTX is the inevitable growth of BEVs. While I have no view on high flying BEV stocks, I fully believe auto’s future is battery powered and BEVs will have a substantial share of the car market. However, we are a long way away from it. BEV penetration is currently ~2% of global auto sales and, unlike say software where you can push a button and instantly distribute a game changing product globally, the BEV transition requires enormous changes in physical infrastructure. For instance, for BEV penetration to grow significantly, the supply of certain materials must drastically increase which requires building new mines in frontier locations. Approximately 70% of the world’s cobalt, a key component in the batteries, is sourced from the Democratic Republic of Congo, a country that has in recent memory fought multiple civil wars and large parts of the country are still under guerilla rule. Further, 15-30% of Congolese cobalt is mined in “artisanal and small scale” mining, which is a polite way of saying unsafe child labor that, in addition to being unethical, does not rapidly scale. We need a 4x increase in cobalt supply to reach even 30% BEV penetration of new car sales. So, while I fully believe BEV is the future of auto, I believe the decline of TBs is a post-2030 event. The market seems to at least partially understands this. For instance, BWA has >90% exposure to legacy ICE yet shares trade at 13x and 11x 2021 and 2022 EPS. While the market is logically applying a discount to ICE exposed auto suppliers, I do not think GTX is likely to trade at such a large discount to similarly ICE-exposed peers once its shares are listed and its fundamental story is better understood.
Given the inevitable secular decline, however, capital allocation is a critical component in GTX’s story. I believe we are in good hands here. As a result of the recapitalization, ~80% of GTX’s shares are owned by private equity and hedge funds, with Centerbridge and Oaktree (C&O) the majority owners. C&O own substantially more preferred shares than equity, something to consider, but the majority of C&Os profits are tied to a higher GTX share price and I believe their interests are aligned with minority shareholders. GTX has not announced capital plans yet, but I believe C&O will soon layout a sensible capital plan, likely emphasizing capital returns and M&A. I believe the legacy ICE space is ripe for consolidation and GTX is likely to play a role in that, either as an acquirer or target.
Finally, while I like many things in the investment, the reason it is my current favorite is I believe GTX has low risk. GTX just admirably handled a horrific auto recession, filed to restructure despite no pressing liquidity or fundamental needs, now has an even safer balance sheet entering an upcycle, and we are getting long at a >50% discount to its closest competitor. Combined with a catalyst rich path forward – investors who would not own a bankrupt equity can reengage; the company will list both the Pref A and equity on a major exchange; the sell side should resume coverage (was covered by 5+ shops previously); C&O announcing capital return plans; GTX increasing guidance, etc. – I believe GTX is an investment where there are many ways to win and few to lose. My favorite type.
Well, there’s GTX. I hope you enjoyed my initial blog post and visit my website GTXisacheapstock.com to further explore the stock. If you liked it, please sign up for the mailing list or follow me on Twitter https://twitter.com/Mc_Partnerships. Thanks!
An Introduction
Hello and welcome to the blog. I’m excited to share my stock ideas and investment musings with you all. My goal is to post at least one post the first week of every month. Please sign up for the mailing list and feel free to reach out to me with any questions.
That’s all for now but I look forward to updating you all on my current top idea – GTX. Stay tuned!
